Average driver distance by gender, age and handicap
What published data says amateurs drive the ball, split by women, men, age and handicap, with the source and sample shown on every table.
The short answer: in the R&A/USGA Distance Insights data, UK male club golfers averaged 216 yards with the driver in 2019, and female club golfers averaged 148 yards (the sources do not say the women's figure covers the same period). By handicap the range runs from 239 to 177 yards for men and 197 to 120 yards for women. Newer Arccos figures for 2026, which are total distance, run higher: 224.1 yards for men and 175.7 for women. This page covers the driver only. For irons, measure one carry you trust and use My Club Distances; golf club gapping covers spacing.
How to read these tables
Distances are in yards, for the driver, and each table names its source, year and who was measured. The R&A/USGA and 2022 Arccos figures as reported do not say whether they are carry (where the ball first lands) or total (carry plus roll), so treat comparisons with your own number as approximate; the 2026 Arccos figures are total. Datasets were collected differently: Distance Insights sampled club golfers at UK venues, and Arccos tracks shots from its app users. Tables from different sources are never merged. The difference between the two labels is in carry vs total distance in golf.
Women
| Group | Driver (yd) | Source | Sample | Carry or total |
|---|---|---|---|---|
| Female club golfers, all handicaps, as reported for the Distance Insights data | 148 | golf.com report on the R&A/USGA Distance Insights project | Not stated | Not stated |
LPGA tour averages are published by TrackMan; tour players are a different population and are not comparable with club golfers. Women's figures by handicap band are in the handicap section below. The women's year is not confirmed in the sources, so the 148 may cover a different period from the men's 2019 figure.
Men
| Group | Driver (yd) | Source | Sample | Carry or total |
|---|---|---|---|---|
| Male club golfers, all handicaps, 2019 | 216 | golf.com report on the R&A/USGA Distance Insights project | 1141 shots from players of varying handicaps | Not stated |
The male data was collected in the United Kingdom, per golf.com's coverage of the earlier annual report. The women's 148 may cover a different period, so the two are not a like-for-like comparison.
By age (men)
| Age | Driver (yd) | Source | Sample | Carry or total |
|---|---|---|---|---|
| 20s | 237 | golf.com article on driving distance and age, citing Arccos | Male Arccos golfers at about the average US Handicap Index (14.1); the Arccos study overall is based on 20 million driver swings | Not stated |
| 30s | 234 | |||
| 40s | 225 | |||
| 50s | 216 | |||
| 60s | 205 | |||
| 70s | 194 |
This is one dataset, so the decline from one age band to the next is a fair comparison. The 216 yard average comes from a different study, so don't compare it with this table even though the 50s row is also 216. Swing speed falls with age too; the golf swing speed chart and driver distance calculator turns your own speed into a distance range. There is no women's age table here.
Beginners
The sources do not measure beginners as a group, and many beginners have no handicap yet, so measure your own drive:
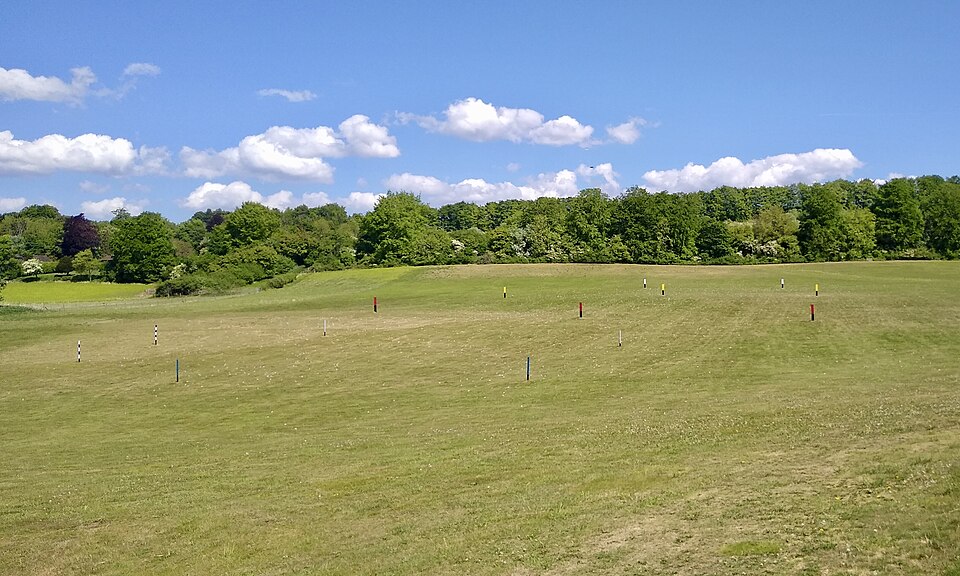
- Hit a set of drives on a range with distance markers, as in the photo above.
- Note where each ball first touches the ground, not where it stops. A launch monitor or phone app that reports carry does the same job.
- Drop the two longest and two shortest, then average the other six. That average is your carry.
- Enter that carry in My Club Distances to get a range for the clubs you have not measured.
If your carry is below the highest-handicap rows below (21 and over for men, 29 and over for women), that is normal for a new golfer. Those rows may include roll, so the real gap may be smaller than it looks.
By handicap
The first two tables are from golf.com's reports on the R&A/USGA Distance Insights data, and the third is Arccos 2026. Bands differ between sources, so match your handicap to the nearest band.
There is no women's row for the handicaps between the last two bands here.
| Handicap | Men (yd) | Women (yd) |
|---|---|---|
| 0.0–4.9 | 244 | 220 |
| 5.0–9.9 | 234 | 206 |
| 10.0–14.9 | 223 | 195 |
| 15.0–19.9 | 212 | 178 |
| 20.0–24.9 | 199 | 167 |
| 25.0–29.9 | 194 | 154 |
| 30+ | 181 | 145 |
| All handicaps | 224.1 | 175.7 |
The Arccos figures are total distance (carry plus roll) on par 4s and par 5s, as summarised by Skillest; the summary gives no sample size. They run higher than the 2019 data partly because they include roll. The Distance Insights tables above are not labelled carry or total, so compare your own number with them only roughly.
Why yours differs
If your numbers sit above or below these rows, check the cause before worrying.
- Carry or total. A total figure includes roll, so comparing your carry to a total average makes you look short. See what each number means.
- Altitude and air. Thinner air at altitude and warm weather let the ball fly farther; cold air shortens it.
- Ball and equipment. Ball model and shaft fit change both distance and spin.
- Strike. Off-centre contact costs distance. An average built from every shot sits below your best shots.
- How it was measured. Launch monitors, app tracking and venue sampling are different methods, which is another reason not to mix tables.
Method and sources
Last updated . Figures are as reported by the linked pages, which cite the R&A/USGA Distance Insights project (2019 data) and Arccos (2022 age data, 2026 handicap data). Club-by-club averages are not given because the sources do not state a sample and a carry-or-total label for them. Sources: